CPU
Track processor utilization as your workload changes.
 MacStats
A little space in your menu bar.
A clearer view of everything underneath.
CPU, memory, network, and more in a native macOS monitor. Keep the numbers you care about close, and get on with your day.
macOS 13+ · Apple silicon & Intel · Free & open source
Preview is ad-hoc signed and not notarized. Installation guide
Always within reach
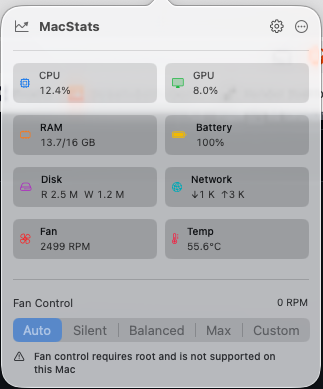
Choose which metrics live in your menu bar, with clear labels and readable values. Click to open the full picture.
Make your menu bar your own ↗
Real system readings, with availability that reflects your hardware.
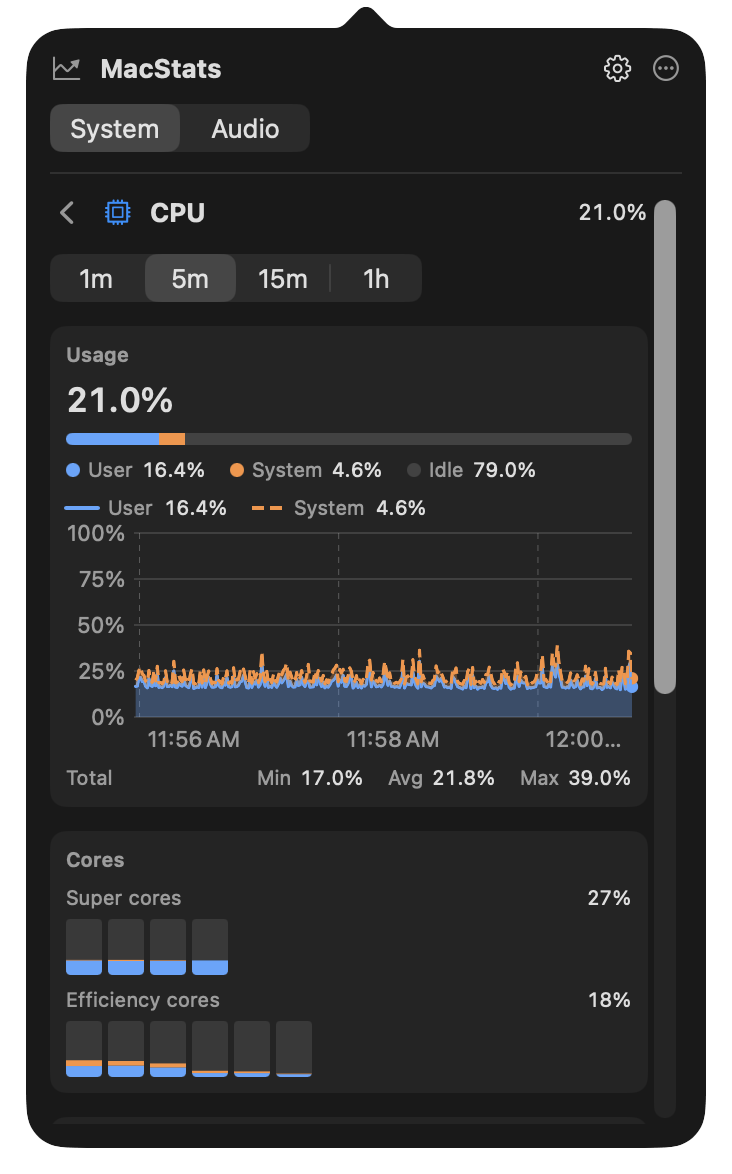
Track processor utilization as your workload changes.
See used and total RAM without opening another app.
Keep an eye on graphics utilization when available.
Check the battery charge on supported Macs.
See how full your startup disk is and how much space is free.
Follow incoming and outgoing network traffic.
Read fan RPM where your Mac exposes it.
Read supported sensors in degrees Celsius.
New in v0.2.0
Click any card to open its detail page right in the popover: live charts, a breakdown of the number, and the context behind it, such as the busiest processes.
New in v0.2.0
An optional Audio tab for your devices and apps.
Pick your default output and input, and set output volume or mute.
Turn individual apps up, down, or off. Requires macOS 14.2 or later.
The mixer is off until you enable it, and macOS asks for audio-capture permission first.
Audio is processed live on your Mac. Nothing is recorded, stored, or sent.
Quietly personal
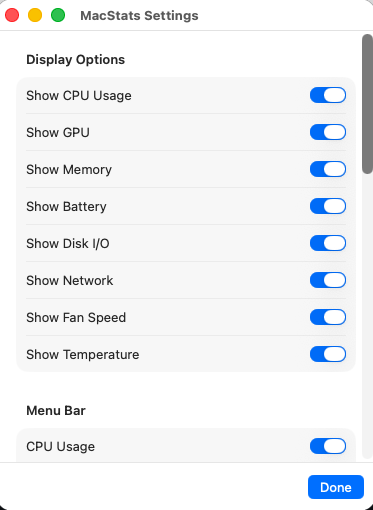
Keep all eight cards in your popover, or pare it back. Pick a refresh interval of 1, 2, 5, or 30 seconds. Launch at login when you want it ready from the start.
Local by design
No account to create. No telemetry. Nothing uploaded by the app, and audio never leaves your Mac.
Read the source, build it yourself, or grab the public preview.